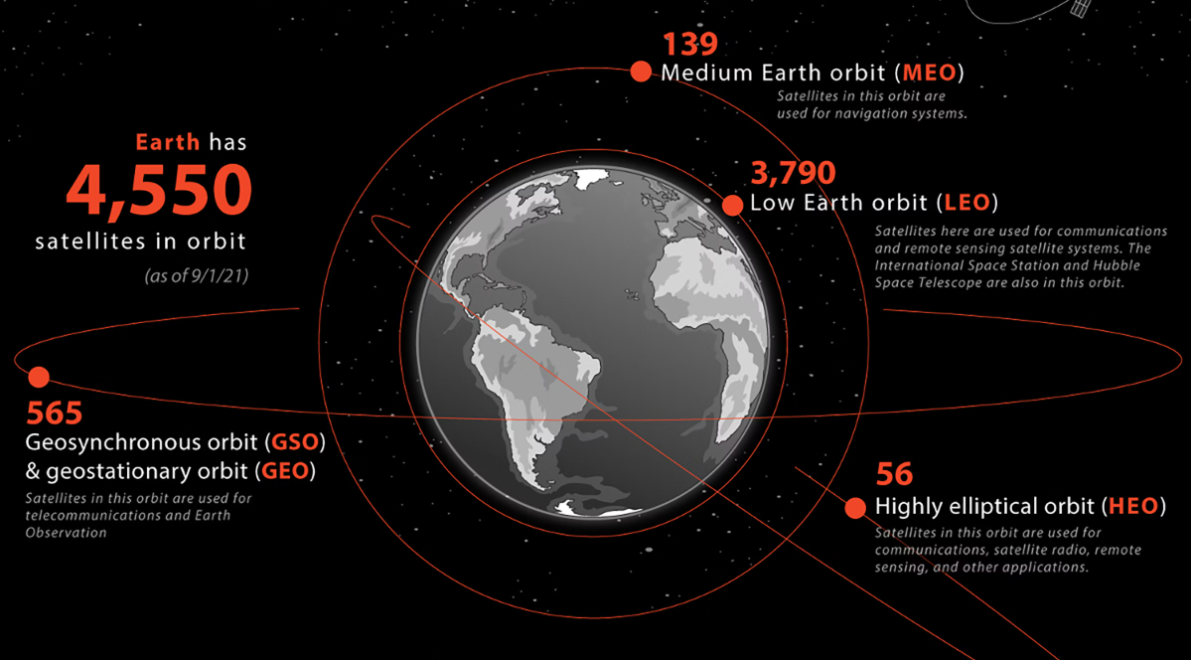
<?xml version="1.0" encoding="utf-8"?><feed xmlns="http://www.w3.org/2005/Atom" xml:lang="en"><generator uri="https://jekyllrb.com/" version="3.10.0">Jekyll</generator><link href="https://krishna1594.github.io/feed.xml" rel="self" type="application/atom+xml" /><link href="https://krishna1594.github.io/" rel="alternate" type="text/html" hreflang="en" /><updated>2026-10-27T08:43:35+00:00</updated><id>https://krishna1594.github.io/feed.xml</id><title type="html">Krishna N Bharatula</title><subtitle>Data analyst working with high-resolution downhole ultrasound data at DarkVision Technologies. Projects and writing on SQL, R, MATLAB and Tableau.</subtitle><author><name>Krishna Nischal Bharatula</name><email>krishnanischal@hotmail.com</email></author><entry><title type="html">Visualizing Satellite Orbits using Matlab</title><link href="https://krishna1594.github.io/blog/SatelliteOrbits" rel="alternate" type="text/html" title="Visualizing Satellite Orbits using Matlab" /><published>2024-03-31T00:00:00+00:00</published><updated>2024-03-31T00:00:00+00:00</updated><id>https://krishna1594.github.io/blog/SatelliteOrbits</id><content type="html" xml:base="https://krishna1594.github.io/blog/SatelliteOrbits"><![CDATA[<p><img src="https://i.postimg.cc/rmJVBDkW/satellite-orbit-info.png" alt="preview" /></p>
<h5 id="source-dewesoft-link">Source: Dewesoft <a href="https://dewesoft.com/blog/every-satellite-orbiting-earth-and-who-owns-them">link</a></h5>

<h2 id="the-purpose-of-this-visualization">The Purpose of this visualization</h2>
<p>I really gave this a thought and my reason is simple. Most of the time when I begin analysing a dataset, I simply use a function I know and my results appear or I search for such functions online and use them simply to get my results but what is the mathematics behind it. Did I forget the mathematics? I am an engineer, I rely on equations to solve problems. So, here I am telling my laptop how to use mathematics and visualize satellites orbiting around our planet. I want to know the mathematics involved in this topic. A data analyst should also know the mathematics behind the analysis. I can confidently apply this idea to my data; geoscience or data science. Alas! I love astronomy too.</p>

<h3 id="satellite-data">Satellite Data</h3>
<p>Probably the complex imagination is being able to pin-point the position of objects in space. We need a coordinate system to effectively understand the behaviour of space and track the movements of objects in space. Such cordinate system called ‘3-Dimensional Cartesian Coordinate System’, is used for understanding and navigating objects and phenomena in space, from celestial bodies and satellites to spacecraft and space missions. It provides a standardized framework for describing positions and movements in the vastness of the cosmos.</p>

<h4 id="data-format-introducing-tle">Data Format: Introducing TLE</h4>
<p>A two-line element set (TLE) or three-line element set (3LE) is a data format encoding a list of orbital elements of an Earth-orbiting object for a given point in time, the ‘epoch’. The United States Space Force tracks all detectable objects in Earth orbit, creating a corresponding TLE for each object, and makes publicly available TLEs for many of the space objects on the websites Space Track and Celestrak, except classified objects. The TLE format is a standard for distribution of an Earth-orbiting object’s orbital elements.</p>

<p>If you want to know how to comprehend a TLE file, then please refer <a href="https://en.wikipedia.org/wiki/Two-line_element_set">here</a>.</p>

<p>We can read the TLE file using the following code in matlab:</p>

<script src="https://gist.github.com/Krishna1594/7dd22c863e21cd6fc4cc3fe636a4629c.js"></script>

<h4 id="data-sources">Data Sources</h4>
<p>I needed the latest orbital details of satellites so, I leveraged <a href="https://celestrak.org/satcat/search.php">celestrack</a>’s database to gather information of satellites and thier orbital data. There are other sources but requires registration. I donwloaded the TLE files of satellites are operational.</p>

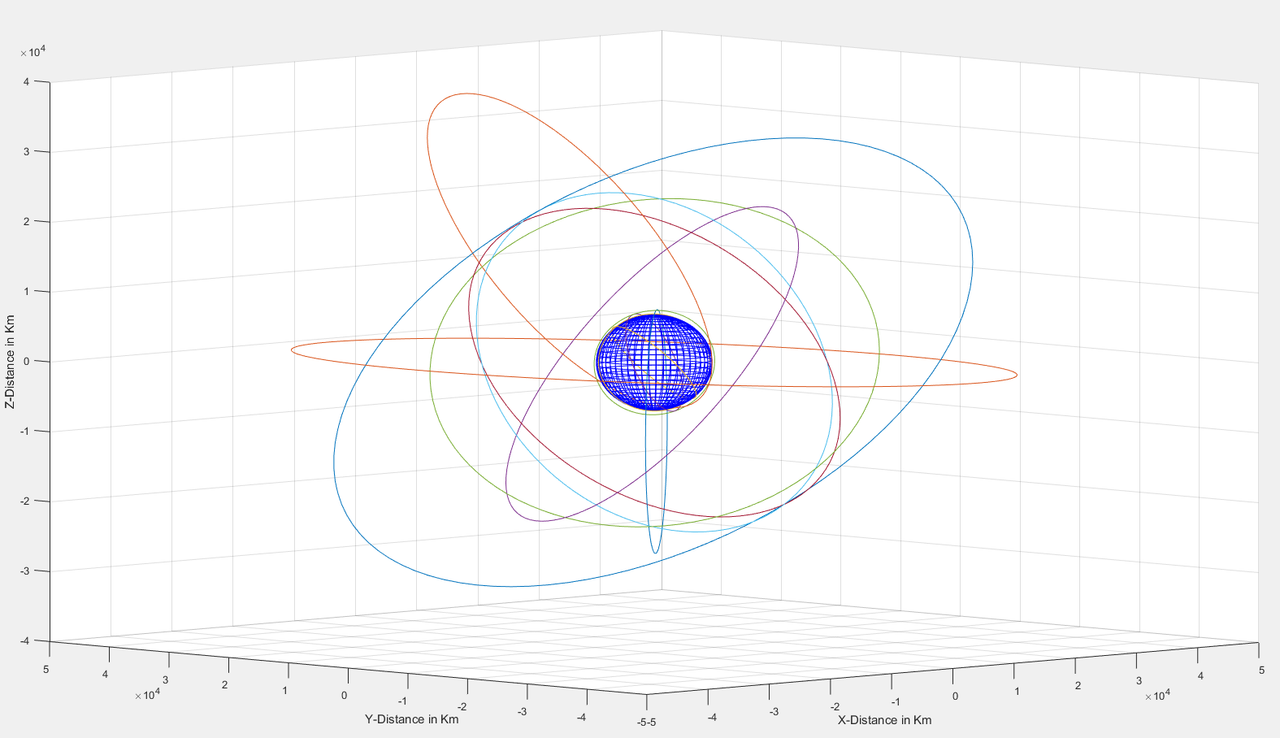
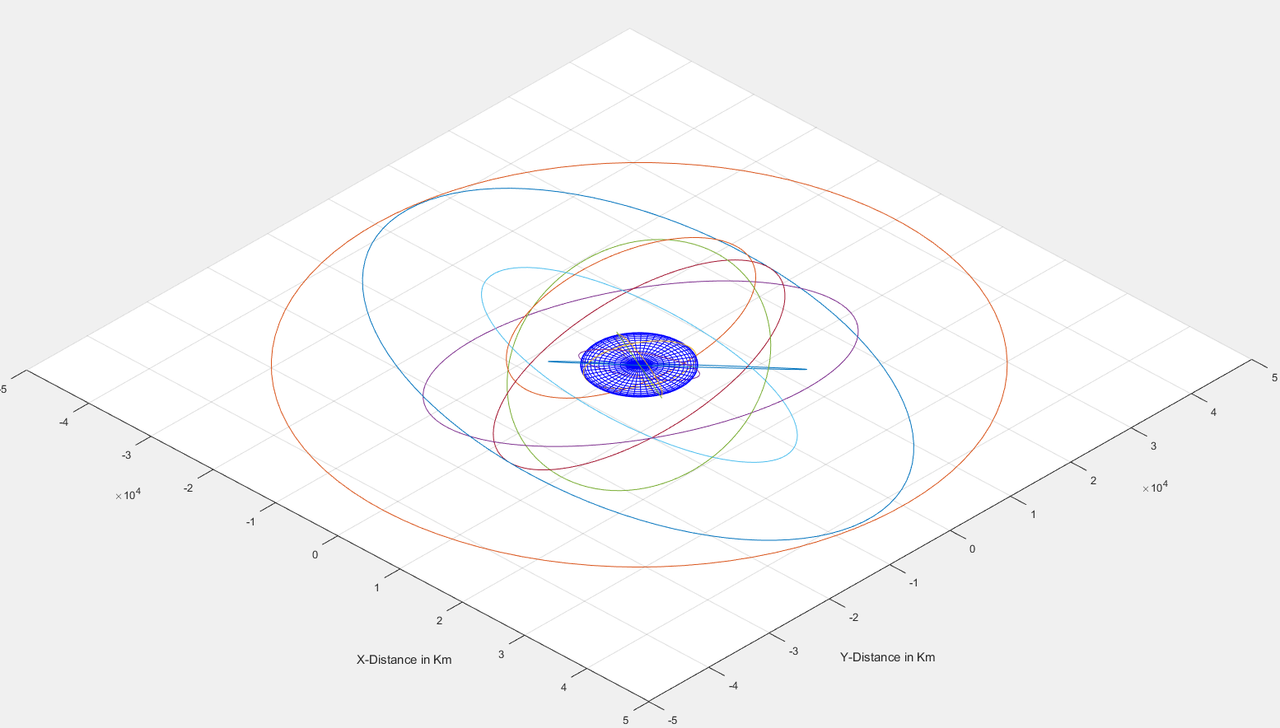
<p>In this visualization, I searched for Medium Earth Orbit (MEO) satellites and couple of Low Earth Orbit (LEO) satellites to understand the magnitude of the distance and how cloose satellites actually revolve around Earth. I googled some MEO satellite names and searched for data in Celestrak. Once you get the TLE data, I copied and pasted the 2 lines in the ‘.txt’ file.</p>

<h3 id="mathematics-involved">Mathematics involved</h3>
<p>To visualize Earth and orbits of satellite, we need 3-D co-ordinate systems for spherical objects (however, Earth is not exactly a sphere, but instead is a Spheroid. This is the closest approximation in our case.). The following equations enables us to imagine a 3D object using cartesian system:</p>

<p><img src="https://i.postimg.cc/fTG61t2B/spherecoord.png" alt="preview" /></p>

<p>The same can be replicated in matlab using ‘Mesh”:</p>

<script src="https://gist.github.com/Krishna1594/05017a216dac3cf422e3d6be04b0991d.js"></script>

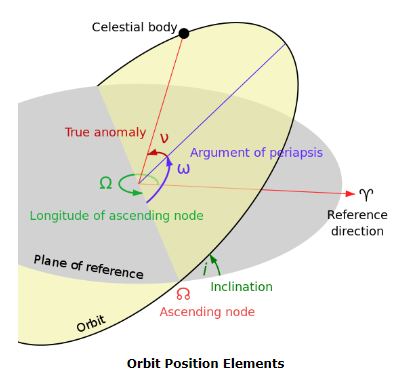
<p>For, orbital elements the following terms are vital to understand the mechanics involverd. I won’t dive deep into orbital mechanics but the orbits made by most satellites are ellipses and can be understood by paremetric ellipse representation and using rotatiojnal matrix representation. First, let’s understand what the terms are:</p>

<p><strong>Eccentricity (e):</strong> Eccentricity is a measure of how much an ellipse deviates from a perfect circle. It is defined as the ratio of the distance between the foci of the ellipse to the length of the semi-major axis. Mathematically, it is represented as:</p>

<p><img src="https://i.postimg.cc/L6sxvzzr/eccen.png" alt="preview" /></p>

<p>Where:
e is the eccentricity.</p>

<p>c is the distance between the center of the ellipse and one of its foci (focus).</p>

<p>a is the length of the semi-major axis.</p>

<p><img src="https://i.postimg.cc/XJQwyzDX/elements.png" alt="Preview" /></p>

<p><strong>Semi-major axis (a)</strong>: The semi-major axis of an ellipse is half of the longest diameter of the ellipse. It is the average distance from the center of the ellipse to its perimeter. In orbital mechanics, the semi-major axis is a fundamental parameter used to describe the size of an orbit. For celestial bodies orbiting a central mass (such as planets around the Sun), the semi-major axis represents the average distance of the body from the center of mass of the system. It is often denoted by the symbol ‘a’.</p>

<p>The semi-major axis is related to the period (T) of an orbit through Kepler’s third law:</p>

<p><img src="https://i.postimg.cc/0jf6MMWv/semimajor.png" alt="Preview" /></p>

<p>For satellites in Earth orbit, the mean motion (mu) is often provided in TLE data. By using this value and the known gravitational parameter of Earth (GM), you can calculate the semi-major axis (a) of the orbit.</p>

<p>For rotation matrix, please refer <a href="https://en.wikipedia.org/wiki/Rotation_matrix">here</a>. We will create a similar rotation matrix for 3 orbital elements of each axis, since it is a 3D rotation.</p>

<p>Now, we will extract the TLE information from the dataset.</p>

<h4 id="tle-data-interpretation">TLE data interpretation</h4>

<p>The two lines hold lot of information regarding the satellite identification and orbital data. let’s extract using the following matlab code:</p>

<script src="https://gist.github.com/Krishna1594/095e0d6591b641d3329708049e79ce57.js"></script>

<p>In matlab, I worte the follwoing code to create the rotation matrix which in turn gives the orbit:</p>

<script src="https://gist.github.com/Krishna1594/f0abbfe53a94bf07d64415f72772c2a4.js"></script>

<h2 id="final-code">Final Code</h2>
<p>The code can be clubbed into one fucntion! I aggregated the code in the following way:</p>

<script src="https://gist.github.com/Krishna1594/6b5e054efb296ee987ed6b959e8c56ec.js"></script>

<p>Now, we will begin our viz. let’s import the data and use the function:</p>

<script src="https://gist.github.com/Krishna1594/8a0c1cf5424d6df8ec3eab8ea4899819.js"></script>

<p>Output:</p>

<p><img src="https://i.postimg.cc/50GHwW17/orbit1.png" alt="Preview" /></p>

<p><img src="https://i.postimg.cc/JhpPJxn6/orbit2.png" alt="Preview" /></p>

<p>And that’s it!</p>

<p>I hope you enjoyed. Furthermore, this viz can be made more sophisticated by adding lot of details to it but, for now, I will leave it here. Mission accomplished!</p>]]></content><author><name>Krishna Nischal Bharatula</name><email>krishnanischal@hotmail.com</email></author><category term="Matlab" /><category term="Astrodynamics" /><category term="Planetary Science" /><category term="Data Visualization" /><category term="3D-Mesh" /><summary type="html"><![CDATA[A method in matlab to visualize the orbits of satellites around the Earth at a given time.]]></summary><media:thumbnail xmlns:media="http://search.yahoo.com/mrss/" url="https://i.postimg.cc/rmJVBDkW/satellite-orbit-info.png" /><media:content medium="image" url="https://i.postimg.cc/rmJVBDkW/satellite-orbit-info.png" xmlns:media="http://search.yahoo.com/mrss/" /></entry><entry><title type="html">A Sci-fi Masterpiece - The Expanse</title><link href="https://krishna1594.github.io/blog/theexpanse" rel="alternate" type="text/html" title="A Sci-fi Masterpiece - The Expanse" /><published>2024-03-19T00:00:00+00:00</published><updated>2024-03-19T00:00:00+00:00</updated><id>https://krishna1594.github.io/blog/theexpanse</id><content type="html" xml:base="https://krishna1594.github.io/blog/theexpanse"><![CDATA[<p><img src="https://i.postimg.cc/RZjF32v9/The-expanse.png" alt="preview" /></p>
<h4 id="source-amazon-prime">Source: Amazon Prime</h4>

<h2 id="the-expanse">The Expanse</h2>
<p>“The Expanse” is a science fiction television series based on the book series of the same name by James S.A. Corey (the pen name for authors Daniel Abraham and Ty Franck). Set in a future where humanity has colonized the solar system, the series explores the political, social, and technological challenges faced by various factions as they navigate the complexities of space exploration, colonization, and interplanetary conflict.</p>

<p>The show first aired on December 14, 2015, with the premiere episode titled “Dulcinea.” The series originally aired on the Syfy network in the United States. It premiered as a two-episode pilot event, with “Dulcinea” followed by the second episode, “The Big Empty,” on the same night. Since then, “The Expanse” has continued to air subsequent seasons, gaining a dedicated fanbase and critical acclaim for its storytelling, world-building, and visual effects.</p>

<p>I really love this show because of the attention-to-detail, which in this show is unparalleled. See for yourself what astrophysicists and astronauts have got to say about “The Expanse”:</p>

<h3 id="astronaut-chris-hadfield-reviews-the-expanse">Astronaut Chris Hadfield reviews ‘The Expanse’</h3>

<div class="embed">
  <iframe src="https://www.youtube-nocookie.com/embed/BkoMHhu0P9Y" title="YouTube video" loading="lazy" allow="accelerometer; encrypted-media; gyroscope; picture-in-picture" allowfullscreen=""></iframe>
</div>

<p>Skip to 12:02 minuites for the review directly.</p>

<h3 id="astrophysicist-dr-becky-smethrust-reviews-the-expanse">Astrophysicist Dr. Becky Smethrust reviews ‘The Expanse’</h3>

<p>Catch Dr. Becky reviewing ‘The Expanse’ in her youtube channel where she highlights the the level of detail in this show.</p>

<div class="embed">
  <iframe src="https://www.youtube-nocookie.com/embed/O25-_eEdxaw" title="YouTube video" loading="lazy" allow="accelerometer; encrypted-media; gyroscope; picture-in-picture" allowfullscreen=""></iframe>
</div>

<h2 id="the-data">The Data</h2>

<p>Actually, I was enthralled by the first and second episodes to an extent where I tabulated data as I watched the rest of the show, in Microsoft Excel and categorized them per each season. I have tabulated my favorite characters from each season, the ships, minute details fo each celestial objects as the plot unfolds. Took around 3 weeks 2 days precisely. Moreover, I had to search inside IMDB website for the show’s ratings dataset and I used that data in this visualization.</p>

<h3 id="cleaning">Cleaning</h3>

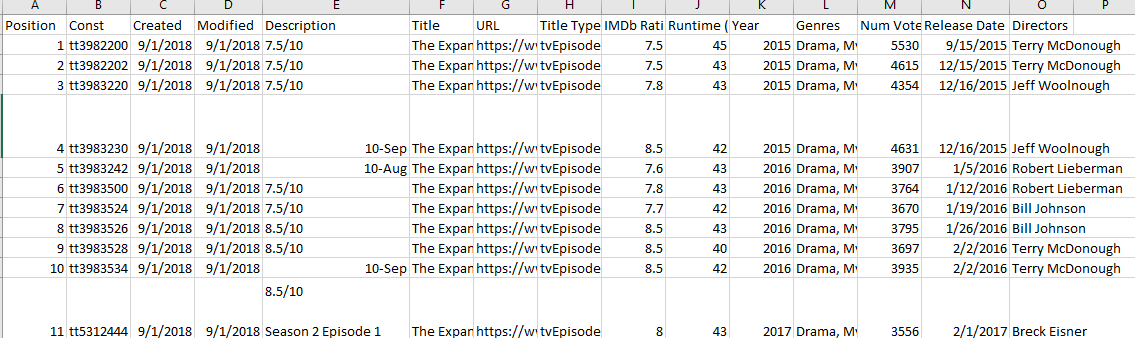
<p>The IMDB ratings dataset for the series is available through <a href="https://www.imdb.com/list/ls029322937/?sort=list_order,asc&amp;st_dt=&amp;mode=simple&amp;page=1&amp;ref_=ttls_vw_smp">here</a>. I exported into a spreadsheet. Once, I opened the sheet, I quickly looked at rows and columns and found some cells have bad data like in the below picture:</p>

<p><img src="https://i.postimg.cc/NMc9PFC5/excel1.png" alt="Preview" /></p>

<p>I formatted the dates selecting pertinent column, here it is “release date” and selected entire rows using excel shortcut Left ctrl+Shift+down arrow(⬇️). Then, I went to ‘format cells’ and selected proper date format “mm/dd/yyyy”.</p>

<p>Now, another important task is to extract season &amp; episode numbers from description column. For this, I used the following function and syntaxes:</p>

<script src="https://gist.github.com/Krishna1594/9a300bae1c65f502e7c9eccd40afde1c.js"></script>

<p>I noticed for the season 1, this problem is not there. So, I just manually assigned my season-episode for season 1 only. I used the above syntax for rows pertaining to season 2 and onwards till season 6.</p>

<p>Further, I extracted episode from the description column and used ‘CONCAT()’ to join both cells as:</p>

<script src="https://gist.github.com/Krishna1594/35b69859a98eb5a712596ffd3437baf2.js"></script>

<p>Now, I can work with this dataset.</p>

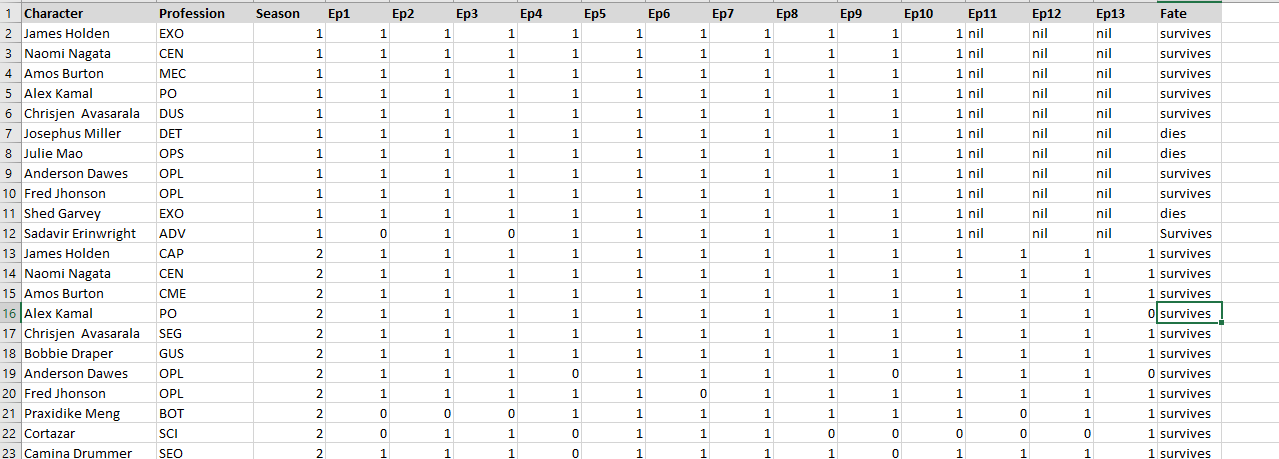
<p>Regarding my dataset which I created, I tabulated in the following manner as I watched all episodes:</p>

<p><img src="https://i.postimg.cc/44FtXfmF/excel2.png" alt="Preview" /></p>

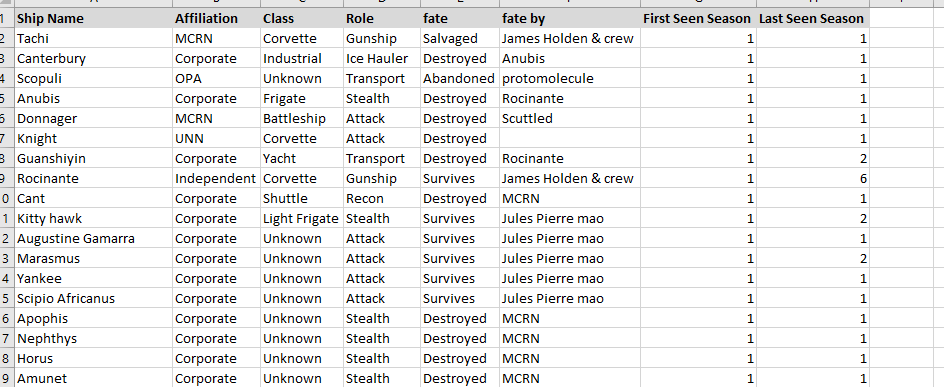
<p>I made new sheets with codes and other information as follows:</p>

<p><img src="https://i.postimg.cc/BvMbNpFw/excel3.png" alt="Preview" /></p>

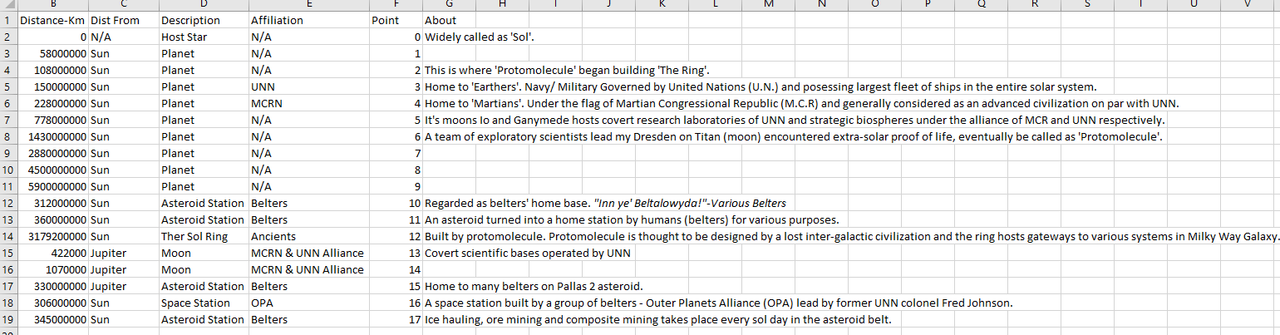
<p>and,</p>

<p><img src="https://i.postimg.cc/d3T0sKxz/excel4.png" alt="Preview" /></p>

<h2 id="organizing">Organizing</h2>

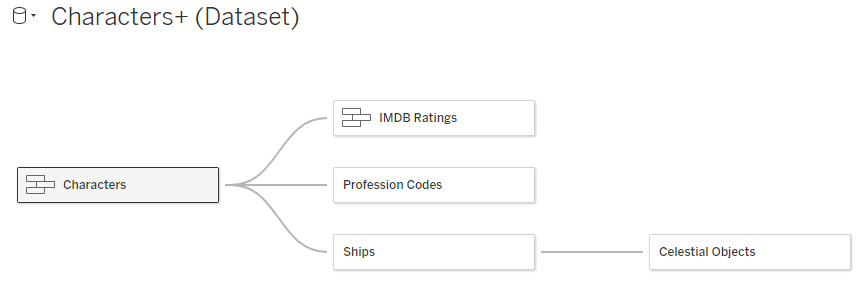
<p>In tableau, I created unions and mapped the database by common columns and the map looks something like this:</p>

<p><img src="https://i.postimg.cc/QM45Vhft/tab1.png" alt="Preview" /></p>

<p>Once I organized each sheet from my dataset with mapping common columns, I worked on creating the visualization.</p>

<h2 id="visualization">Visualization</h2>

<p>I came up with lot of ideas in visualizing this dataset that is both interactive and fun to look at data. One stunning aspect of the series as pointed out by the astronauts and astrophysicsts is the physics aspect of space and time. So, when you watch the series you will find how distant each celestial object is and the times they have included in trasmitting any message withhin the show as the plot goes on (they actually pointed out that 27minutes of time delay of message from Martian leaders and 6 hours of time delay from marines in Jupiter/Saturn).</p>

<p>This drove me to create a dataset with actual distances of objects in space using ‘Astronaumical Units’ as measurement of distance. For the ‘Sol Ring’ or ‘The Ring’, the show said “Sol Ring - in stable orbit beyond Uranus”. I came up with a fictional number and incorporated in my dataset.</p>

<h3 id="chart-selection">Chart Selection</h3>

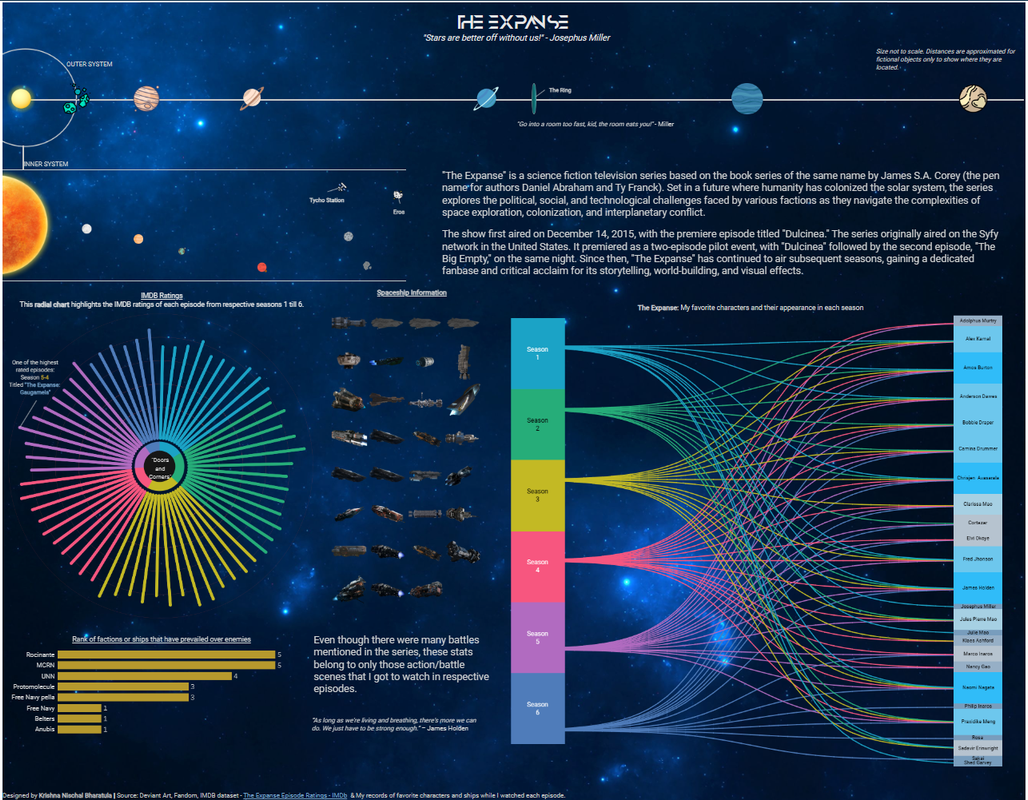
<p>I utilized ‘Starburst chart’ and ‘Sankey Chart’ to visualize my data while enabling me to tell a better story and information for the viewers. While starburst chart highlights rating details and meta data of each episode, the sankey chart tells which characters starred in each season. The same characters appeared in other seasons too. I couldn’t find a better chart than this one. Sankey chart works best for data having a flow of information.</p>

<p>For ships data, I simply used a bar chart that highlights which ships had the highest kill streaks or ‘splash’ count.</p>

<p>Thus, here is my viz’</p>

<p><img src="https://i.postimg.cc/j2jFPxbF/viz.png" alt="" /></p>

<p>Dashbaord Link: <a href="https://public.tableau.com/app/profile/krishna.n.bharatula/viz/TheExpanse/Dashboard1">The Expanse Dashbard</a>.</p>

<h2 id="acknowledgements">Acknowledgements</h2>

<p>I must thank the whole team of ‘The Expanse’ for entertaining me. While the show was being aired, the cast were doing live sessions talking to the fans and having fun. I got a chance to look back at the videos for a brief amount of time. Actually, I watched this show for the 6th time!</p>

<p>I thank <a href="https://expanse.fandom.com/wiki/The_Expanse_Wiki">Fandom</a> and <a href="https://www.imdb.com/?ref_=nv_home">IMDB</a> for the data and ship icons. I do not have any rights over the imdb ratings data and ships design or icon files. All the rights are with Fandom, IMDB and Alcon Television Group who produced this show. I just used what was publicly available. If anyone finds this as a breach, please let me know through here <a href="https://www.linkedin.com/in/krishna-nischal-bharatula/">LinkedIn</a>.</p>

<p>I created this viz for improving my data analytics skills and NOT for any promotional purposes. Do follow Fandom, IMDB and <a href="https://www.alconent.com/new-tv/the-expanse-seasons-1-6/?showpage=0">Alcon Entertainment</a> for more details about the show.</p>

<p>I thank <a href="https://www.linkedin.com/in/trevor2maxwell/">Trevor Maxwell</a> for helping me in making the sankey chart better.</p>

<p>Thank you for taking time in reading this article and do let me know what you think about the viz by reaching out to me through <a href="https://www.linkedin.com/in/krishna-nischal-bharatula/">LinkedIn</a>.</p>

<p>If you like the viz, please don’t forget to nominate the viz for ‘Viz Of The Day’.</p>

<p>Another viz done for the day!</p>]]></content><author><name>Krishna Nischal Bharatula</name><email>krishnanischal@hotmail.com</email></author><category term="TVShows" /><category term="Tableau" /><category term="Data Visualization" /><category term="Excel" /><summary type="html"><![CDATA[Visualizing one of my favorite TV shows in tableau.]]></summary><media:thumbnail xmlns:media="http://search.yahoo.com/mrss/" url="https://i.postimg.cc/RZjF32v9/The-expanse.png" /><media:content medium="image" url="https://i.postimg.cc/RZjF32v9/The-expanse.png" xmlns:media="http://search.yahoo.com/mrss/" /></entry><entry><title type="html">Dosa - History &amp;amp; Preferences</title><link href="https://krishna1594.github.io/blog/Dosa" rel="alternate" type="text/html" title="Dosa - History &amp;amp; Preferences" /><published>2024-02-24T00:00:00+00:00</published><updated>2024-02-24T00:00:00+00:00</updated><id>https://krishna1594.github.io/blog/Dosa</id><content type="html" xml:base="https://krishna1594.github.io/blog/Dosa"><![CDATA[<p><img src="https://i.postimg.cc/nzRbtt1c/dosa.jpg" alt="preview" /></p>

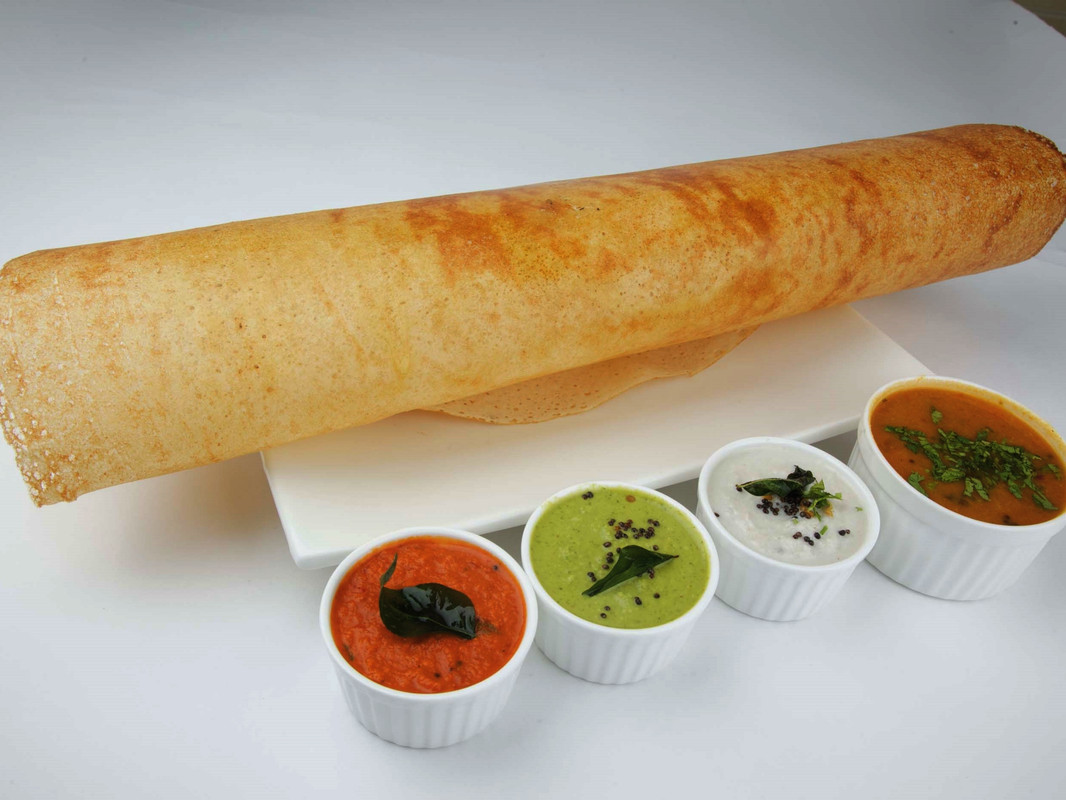
<h2 id="an-iconic-south-indian-dish">An iconic South Indian Dish</h2>
<p>Was ‘dosa’, an accident? Oh! there is a story about this too, passed down since ages that a brahmin accidentaly created dosa. One more story involved a king’s ‘bawarchi’ or chef who didn’t want to waste food, so ended up with this idea of dosa.🫠</p>

<p>Nonetheless, an accurate time, place and person couldn’t be determined on how dosa became what it is today; “Favorite dish”. More like a traditional culinary dish passed down to generations in the form of backtories with several modifications. Anyway, I did my own digging to find if there are any references of dosa in the past and guess what, I found many!</p>

<h3 id="where-is-dosa-data-though">Where is ‘Dosa’ data though?</h3>

<p>I found data about pizza, burger, sandwich, spaghetti and meatballs but nothing about dosa. So, I tried to gather data on my own. I came up with a survey on google forms.</p>

<p>If you are interested in helping me gather data on dosa, please fill the surevy here: <a href="https://forms.gle/XymVk6FfSUaUTbfL7">Dosa Survey</a>.</p>

<p>Coming back to my quest of finding data on dosa, you might ask why dosa? Well, I love dosa. They are thin and crispy and I can gulp 10 dosas in one sitting. 🤣 Heard lot of stories about the dish and I loved my mother making dosa while I stood next to her with my plate in hands ready to be eaten. Can’t argue with mom’s cooking skills and home food. Home food is the best!🥰</p>

<p>So, what I did is grab the responses from the survey and work on this data.</p>

<h4 id="survey-data">Survey Data</h4>

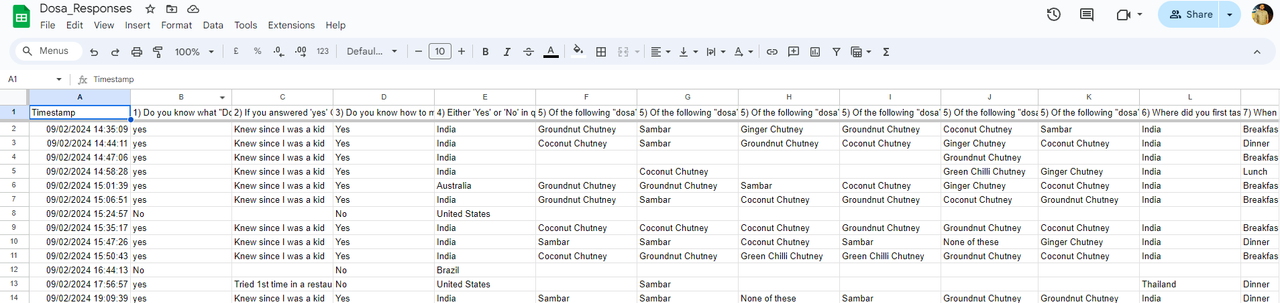
<p>Surveying was the fun part in this mini-project because I was more inclined towards spreading the survey to various groups of different ages. I hosted this survey on google forms and distributed in my Whatsapp groups, on LinkedIn, Instagram and on reddit. Survey contains no personal information; only choices, age in bins, geographical location-country. The questions are about a person’s preference of having various dosa with various chutneys.</p>

<p>Reached out to my peers and friends to spread the survey. I captured about <strong>96 responses in 2 weeks</strong>. Well, its not bad and not the best either. At least close to 100 gives a good sample size for this project. I wanted to increase the complexity in this mini-project, so I crafted the survey in such a way that data is of ‘string’ type only. All the responses were ‘strings’ or text:</p>

<p><img src="https://i.postimg.cc/m2ZRq8Nr/data-shot.png" alt="" /></p>

<p>Then I trimmed my column names, since I didn’t have a big data problem I did it manually. Then loaded in my tableau.</p>

<h3 id="tableau-dashboard">Tableau Dashboard</h3>

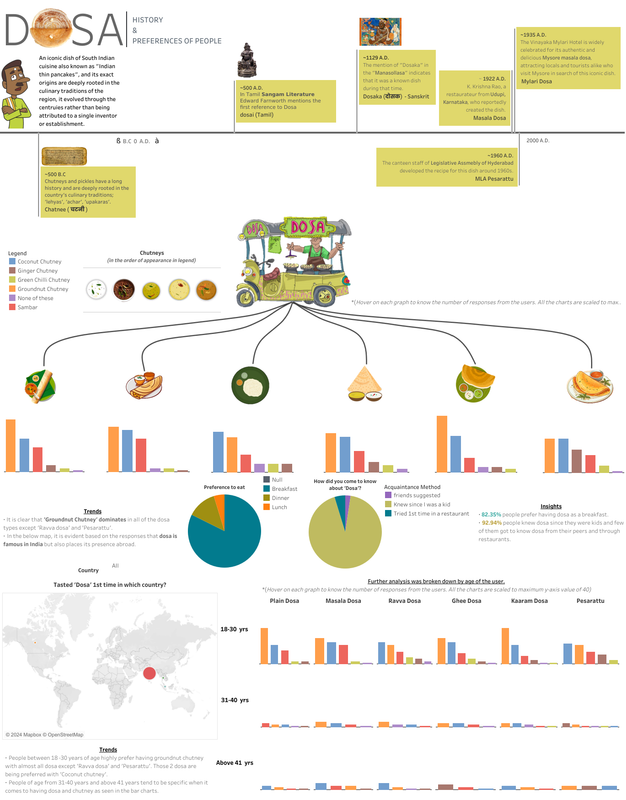
<p>Working with this dataset was fun and brought lot of hidden insights which I included on my dashboard.</p>

<p>Features of the viz:</p>

<p>a. Timeline and dates (excel can’t handle calendars before 1900, so I made new column; say ‘-500’ for BCE): to make a historical timeline.</p>

<p>b. Union and common table keys (created an Id ‘text’ so that I could join tables in tableau and plot).</p>

<p>c. Handling strings &amp; Parameter calculations for percentages using “COUNT()” and “TOTAL(SUM())” to make pie charts since I have only 3 categories, pie charts are easy to understand.</p>

<h4 id="dashboard">Dashboard</h4>

<p>Few of the questions I asked:</p>

<p>a. Is any chutney the most preferred choice for a dosa?</p>

<p>b. How many people know about dosa and how did they hear about dosa in the first place?</p>

<p>c. When do they prefer having dosa: breakfast, Lunch, dinner or snack?</p>

<p>d. Is there a trend between age group and dosa preference?</p>

<p>e. Where did people tasted dosa: Country?</p>

<p>Thus, I made the following dashboard.</p>

<p><img src="https://i.postimg.cc/FRc0bvsC/Dashboard-1.png" alt="" /></p>

<p>One of the most interesting insight here is that <strong>no one preferred dosa as a snack!</strong></p>

<h3 id="conclusion">Conclusion</h3>

<p>The preferences of people are well visualized in this dashboard and saw that ‘dosa’ is spread across the world but I have to gather more data on this aspect. I need a bigger sample but for now, I got enough responses.</p>

<p>The dataset is available on my <a href="https://github.com/Krishna1594/Dosa_History-and-Preferences">github</a> and here is my link to the <a href="https://public.tableau.com/app/profile/krishna.n.bharatula/viz/HistoryofDosaPreferences/Dashboard1">dashboard</a></p>

<p>If you have found any mistakes, please let me know by messaging me through my <a href="https://www.linkedin.com/in/krishna-nischal-bharatula/">linkedIn</a>.</p>

<p>Bon Appetite!</p>]]></content><author><name>Krishna Nischal Bharatula</name><email>krishnanischal@hotmail.com</email></author><category term="Food" /><category term="Data Visualization" /><category term="History" /><category term="Survey" /><category term="Food Analytics" /><summary type="html"><![CDATA[I always wondered how old is a "Dosa"? I kept eating since my childhood and wanted to track its history and the choices of people when it comes to this dish.]]></summary><media:thumbnail xmlns:media="http://search.yahoo.com/mrss/" url="https://i.postimg.cc/nzRbtt1c/dosa.jpg" /><media:content medium="image" url="https://i.postimg.cc/nzRbtt1c/dosa.jpg" xmlns:media="http://search.yahoo.com/mrss/" /></entry><entry><title type="html">The Exoplanets</title><link href="https://krishna1594.github.io/blog/Exoplanets" rel="alternate" type="text/html" title="The Exoplanets" /><published>2024-02-07T00:00:00+00:00</published><updated>2024-02-07T00:00:00+00:00</updated><id>https://krishna1594.github.io/blog/Exoplanets</id><content type="html" xml:base="https://krishna1594.github.io/blog/Exoplanets"><![CDATA[<p><img src="https://i.postimg.cc/3wfcC3RT/gamepost.png" alt="preview" />
<em>*Source: EVERSPACE 2 in-game screenshot</em></p>

<p>Okay Let’s see,</p>

<p><strong>My Telescope features:</strong></p>

<p>Location: On Earth</p>

<p>1) Scientific Explorer-102/600mm (focal Length) Achromatic Double Refractor</p>

<p>2) FujiFilm mirrorless camera with amazing shutter speeds with mountable T-attachment</p>

<p>3) An autotracker Equitorial Mount</p>

<p><strong>Nasa’s James Webb Space Telescope:</strong></p>

<p>Location: 1.5million Km away from earth (L2-point) in space</p>

<p>1) A jawdropping focal length of 131.4m</p>

<p>2) Foldable primary mirrors of diameter 6.5m.</p>

<p>3) Sun shield and temperature resistant for another 10 years.</p>

<p>Yeah, mine is dumb!</p>

<p>Anyway, I would like to tell you that technology in space exploration has improved a lot in the past decade or so. I found the Exoplanets dataset from Nasa Exoplanets Archive website. You can access the dataset from <a href="https://exoplanetarchive.ipac.caltech.edu/index.html">here</a>. Let me first thank NASA and their program. Allow me to properly state and give dredit to my source.</p>

<blockquote>
  <p>This research has made use of the NASA Exoplanet Archive, which is operated by the California Institute of Technology, under contract with the National Aeronautics and Space Administration under the Exoplanet Exploration Program.</p>
</blockquote>

<h2 id="the-exoplanets">The Exoplanets</h2>

<p>The universe is too vast to even consider ruling out any possibility of finding earth-like planet. But, with our current technology, we might not yet say for certainity that such planets could host life. In coming decades we might advance in our space research programs but for now, we know that there are other solar systems with planets in ‘Goldilock Zones’ such as our planet Earth.</p>

<p>Since 1992, NASA began its search to find earth-like planets and such planetart systems. Alas! we are shoked to see that they exist.</p>

<p>Exoplanets, also known as extrasolar planets, are planets that exist outside of our solar system and orbit stars other than the Sun. These planets are located in other stellar systems, which can be nearby stars within our Milky Way galaxy or stars in distant galaxies.</p>

<p>Exoplanets vary widely in size, composition, and characteristics, ranging from small rocky planets similar to Earth to massive gas giants like Jupiter and even exotic worlds with extreme conditions. They are typically detected through indirect methods, as they are too distant and faint to be observed directly with current technology.</p>

<h3 id="the-dataset">The Dataset</h3>

<p>The dataset is well documented and arranged but there are lot of missing values. I didn’t want to omit them as they have interesting parameters or features compared to Earth. Further into my analysis for specific purposes and metrics, I excluded nulls.
I used Tableau to visualize the data.</p>

<p>Let me tell you, I went creative on this viz. I have a collection of fonts in my laptop and one just suits this viz. Its ANURATI from Emmeran Richard. I found interesting facts and I did some of my own digging to learn about aastrophysics. So here is what I did with the dataset;</p>

<p><img src="https://i.postimg.cc/qMCwW8vW/Dashboard-A.png" alt="" /></p>

<p>As you can see, its creative.</p>

<h3 id="interesting-insights">Interesting Insights</h3>

<p>Let me tell you some key takeaways:</p>

<p>1) There are a total of 5572 exoplanets discovered since 1992-2023. I used a starburst chart or circular bar chart to show planets discovered in each year.</p>

<p>2) Some planets are very close to its star, some very distant, some are very lighter and some are heavier than Earth. The planet <strong>HD 100546 b</strong> is <strong>77.34 times larger than Earth</strong> but not the heaviest!</p>

<p>3) The heaviest planet <strong>HR 2562 is 9535 times heavier than Earth</strong> but much smaller than that of giant planet HD 100546 b! This planet <strong>HR 2562</strong> is 12.14 times larger than Earth.</p>

<p>4) Lot of different methods have been used to identify or discover exoplanets as you can see in the viz.</p>

<p>5) Unlike planet earth that revolves around sun at an orbital inclination of 7°, some planets literally revolve perpendicularly (90° - orbital inclination). I categorzed them into bins as depicted in the plot below:</p>

<p><img src="https://i.postimg.cc/HWKnVM9Y/orbital-incls.png" alt="" /></p>

<p>6) One of the important aspects of possible life on any planet is its Sun. Oh, let me correct myself. Its Star! Sun is ours though. So, I dived into the evolution of stars indicators such as their age, their temperature, their radiii, their mass and their metallicity that could help us understand the planetary system formation and possibly composition of systems.</p>

<p>7) This datasets reveals that lot of planets do fall in the goldilocks zone (assuming that the size of star remains constant) and that is a harder parameter to visualize because that zone varies with Stellar’s radius, planet’s orbital inclination &amp; speed and Stellar’s temperature. If the star is hot, the zone pushes further back and days could get longer. So, I might end up doing more research on this topic.</p>

<p>Overall, this has been an amazing project for me to imporve skills in <strong>Tableau</strong> and put my creativity skills to good use. This viz is available on my <a href="https://public.tableau.com/app/profile/krishna.n.bharatula/viz/TheExoplanets/DashboardA">Tableau</a> profile or on my <a href="https://github.com/Krishna1594/The-Exoplanets">Github</a>.</p>

<p>Let me know how you felt about my viz. I am open to any feedback or suggestion you have. Kindly, DM me through my <a href="https://www.linkedin.com/in/krishna-nischal-bharatula/">LinkedIn</a>.</p>

<p>If you have any interesting dataset and open to collaborate, I am game!</p>]]></content><author><name>Krishna Nischal Bharatula</name><email>krishnanischal@hotmail.com</email></author><category term="Astrophotography" /><category term="Astrophysics" /><category term="Tableau" /><category term="Data Visualization" /><category term="Research" /><summary type="html"><![CDATA[Do they host life? or just a possibility?]]></summary><media:thumbnail xmlns:media="http://search.yahoo.com/mrss/" url="https://i.postimg.cc/3wfcC3RT/gamepost.png" /><media:content medium="image" url="https://i.postimg.cc/3wfcC3RT/gamepost.png" xmlns:media="http://search.yahoo.com/mrss/" /></entry><entry><title type="html">Diamonds in the sky</title><link href="https://krishna1594.github.io/blog/Astrophotography" rel="alternate" type="text/html" title="Diamonds in the sky" /><published>2024-01-31T00:00:00+00:00</published><updated>2024-01-31T00:00:00+00:00</updated><id>https://krishna1594.github.io/blog/Astrophotography</id><content type="html" xml:base="https://krishna1594.github.io/blog/Astrophotography"><![CDATA[<p><img src="https://i.postimg.cc/sxFxNkz5/collection.png" alt="preview" /></p>

<h2 id="that-sheer-tranquility-just-amazes-me">That sheer tranquility just amazes me!</h2>

<p>I don’t exactly remember when I got a notification regarding Earth’s big brother. Apparently, he decided to meet for a whole month. If you don’t believe me you better follow <a href="https://science.nasa.gov/jupiter/">Nasa</a></p>

<p>Just scroll down a little bit and you will see who I’m talking about!</p>

<p><img src="https://i.postimg.cc/rsVh4FZp/1664785226731.jpg" alt="preview" /></p>

<p>Yes! that’s Jupiter and 5 moons and 4 (Io, Ganymede, Europa and Callisto) are visible in this picture. This picture was taken in October 2022 though.</p>

<p>Do visit my <a href="https://www.instagram.com/p/CjOdXQyB72EgLBIrKWvtmz5xR-b4Emdekv0uL80/?hl=en">instagram</a> to know more!</p>

<h2 id="just-a-touch">Just a touch!</h2>

<p>Well in early days of my astrophotography, I captured some bad and unclear pictures. To my eyes, when I looked into the eyepiece, the view was unparalleled. Did you know our eyes are the best cameras? like each eye has a resolution of 576MP. For a comparison, your Iphone only has 12MP camera. That’s stunning clarity, our eyes have. So, protect your eyes. Eat lot of carrots!🤗</p>

<p>Hence, I wanted to take some quality pictures. I used data from my hobby. See how far I have gazed into the skies!</p>

<p><img src="https://i.postimg.cc/2S0jqrr8/Gazed.png" alt="preview" /></p>

<p>I did a mini-project on my hobby. If you want to know more how I improved my astrophotography, you should visit my <a href="https://github.com/Krishna1594/Astrophotography">github</a></p>

<p>Let me know what you think!</p>]]></content><author><name>Krishna Nischal Bharatula</name><email>krishnanischal@hotmail.com</email></author><category term="Astrophotography" /><summary type="html"><![CDATA[I know there is black gold inside our earth's crust, but how often do you see the diamonds in the sky?]]></summary><media:thumbnail xmlns:media="http://search.yahoo.com/mrss/" url="https://i.postimg.cc/sxFxNkz5/collection.png" /><media:content medium="image" url="https://i.postimg.cc/sxFxNkz5/collection.png" xmlns:media="http://search.yahoo.com/mrss/" /></entry></feed>