Dosa - History & Preferences
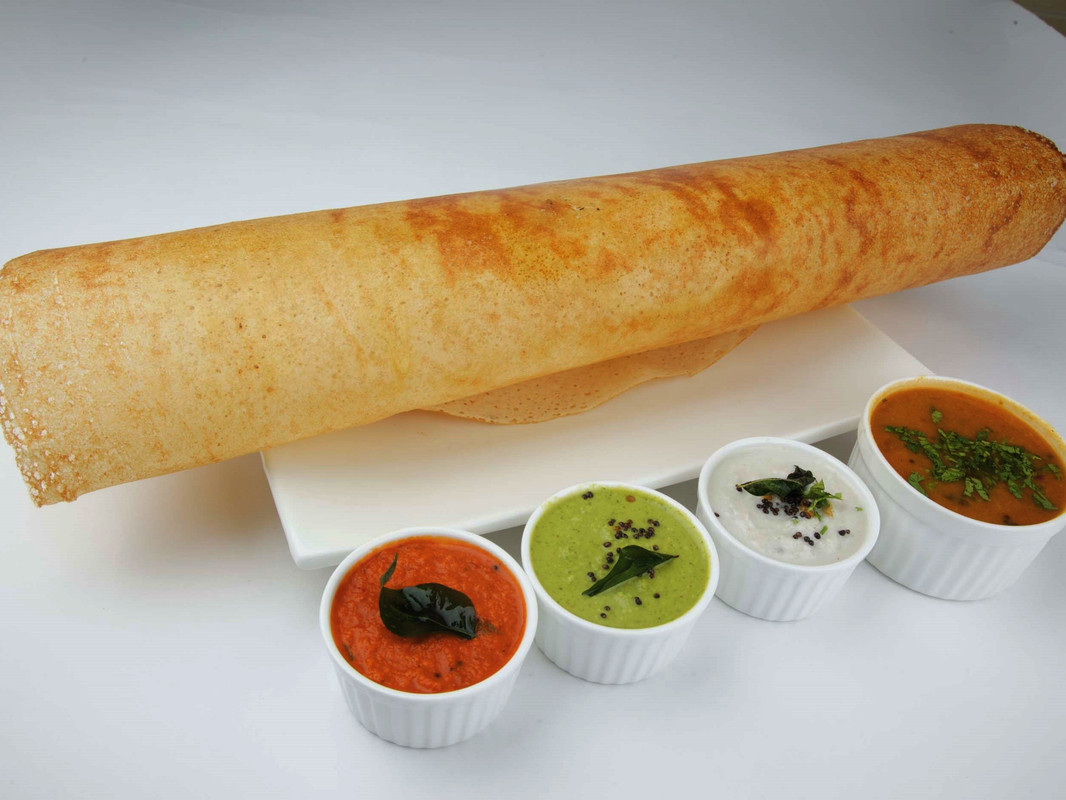
An iconic South Indian Dish
Was ‘dosa’, an accident? Oh! there is a story about this too, passed down since ages that a brahmin accidentaly created dosa. One more story involved a king’s ‘bawarchi’ or chef who didn’t want to waste food, so ended up with this idea of dosa.🫠
Nonetheless, an accurate time, place and person couldn’t be determined on how dosa became what it is today; “Favorite dish”. More like a traditional culinary dish passed down to generations in the form of backtories with several modifications. Anyway, I did my own digging to find if there are any references of dosa in the past and guess what, I found many!
Where is ‘Dosa’ data though?
I found data about pizza, burger, sandwich, spaghetti and meatballs but nothing about dosa. So, I tried to gather data on my own. I came up with a survey on google forms.
If you are interested in helping me gather data on dosa, please fill the surevy here: Dosa Survey.
Coming back to my quest of finding data on dosa, you might ask why dosa? Well, I love dosa. They are thin and crispy and I can gulp 10 dosas in one sitting. 🤣 Heard lot of stories about the dish and I loved my mother making dosa while I stood next to her with my plate in hands ready to be eaten. Can’t argue with mom’s cooking skills and home food. Home food is the best!🥰
So, what I did is grab the responses from the survey and work on this data.
Survey Data
Surveying was the fun part in this mini-project because I was more inclined towards spreading the survey to various groups of different ages. I hosted this survey on google forms and distributed in my Whatsapp groups, on LinkedIn, Instagram and on reddit. Survey contains no personal information; only choices, age in bins, geographical location-country. The questions are about a person’s preference of having various dosa with various chutneys.
Reached out to my peers and friends to spread the survey. I captured about 96 responses in 2 weeks. Well, its not bad and not the best either. At least close to 100 gives a good sample size for this project. I wanted to increase the complexity in this mini-project, so I crafted the survey in such a way that data is of ‘string’ type only. All the responses were ‘strings’ or text:
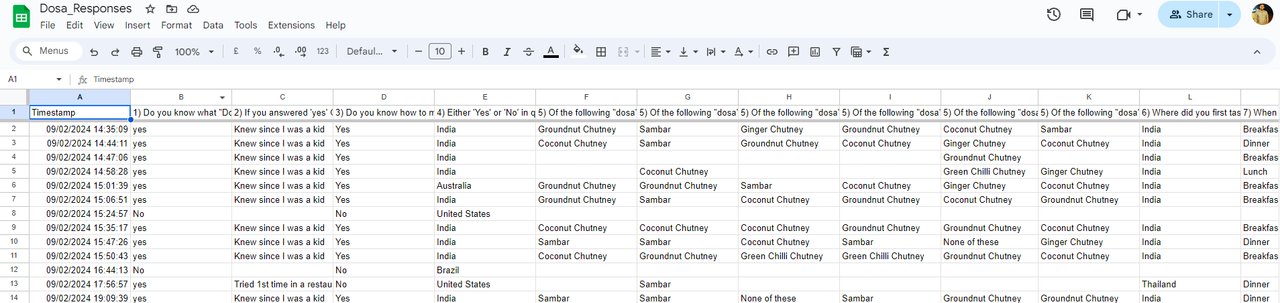
Then I trimmed my column names, since I didn’t have a big data problem I did it manually. Then loaded in my tableau.
Tableau Dashboard
Working with this dataset was fun and brought lot of hidden insights which I included on my dashboard.
Features of the viz:
a. Timeline and dates (excel can’t handle calendars before 1900, so I made new column; say ‘-500’ for BCE): to make a historical timeline.
b. Union and common table keys (created an Id ‘text’ so that I could join tables in tableau and plot).
c. Handling strings & Parameter calculations for percentages using “COUNT()” and “TOTAL(SUM())” to make pie charts since I have only 3 categories, pie charts are easy to understand.
Dashboard
Few of the questions I asked:
a. Is any chutney the most preferred choice for a dosa?
b. How many people know about dosa and how did they hear about dosa in the first place?
c. When do they prefer having dosa: breakfast, Lunch, dinner or snack?
d. Is there a trend between age group and dosa preference?
e. Where did people tasted dosa: Country?
Thus, I made the following dashboard.
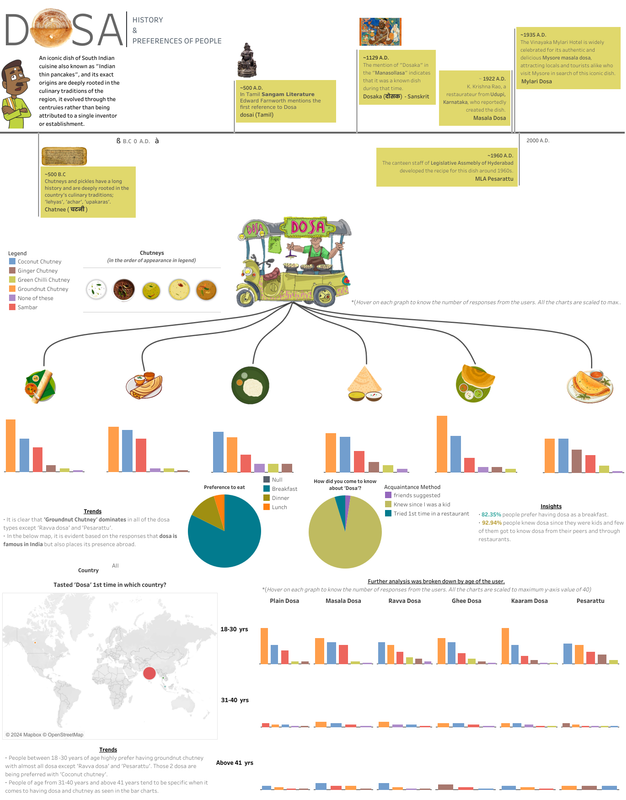
One of the most interesting insight here is that no one preferred dosa as a snack!
Conclusion
The preferences of people are well visualized in this dashboard and saw that ‘dosa’ is spread across the world but I have to gather more data on this aspect. I need a bigger sample but for now, I got enough responses.
The dataset is available on my github and here is my link to the dashboard
If you have found any mistakes, please let me know by messaging me through my linkedIn.
Bon Appetite!