Visualizing Satellite Orbits using Matlab
Source: Dewesoft link
The Purpose of this visualization
I really gave this a thought and my reason is simple. Most of the time when I begin analysing a dataset, I simply use a function I know and my results appear or I search for such functions online and use them simply to get my results but what is the mathematics behind it. Did I forget the mathematics? I am an engineer, I rely on equations to solve problems. So, here I am telling my laptop how to use mathematics and visualize satellites orbiting around our planet. I want to know the mathematics involved in this topic. A data analyst should also know the mathematics behind the analysis. I can confidently apply this idea to my data; geoscience or data science. Alas! I love astronomy too.
Satellite Data
Probably the complex imagination is being able to pin-point the position of objects in space. We need a coordinate system to effectively understand the behaviour of space and track the movements of objects in space. Such cordinate system called ‘3-Dimensional Cartesian Coordinate System’, is used for understanding and navigating objects and phenomena in space, from celestial bodies and satellites to spacecraft and space missions. It provides a standardized framework for describing positions and movements in the vastness of the cosmos.
Data Format: Introducing TLE
A two-line element set (TLE) or three-line element set (3LE) is a data format encoding a list of orbital elements of an Earth-orbiting object for a given point in time, the ‘epoch’. The United States Space Force tracks all detectable objects in Earth orbit, creating a corresponding TLE for each object, and makes publicly available TLEs for many of the space objects on the websites Space Track and Celestrak, except classified objects. The TLE format is a standard for distribution of an Earth-orbiting object’s orbital elements.
If you want to know how to comprehend a TLE file, then please refer here.
We can read the TLE file using the following code in matlab:
Data Sources
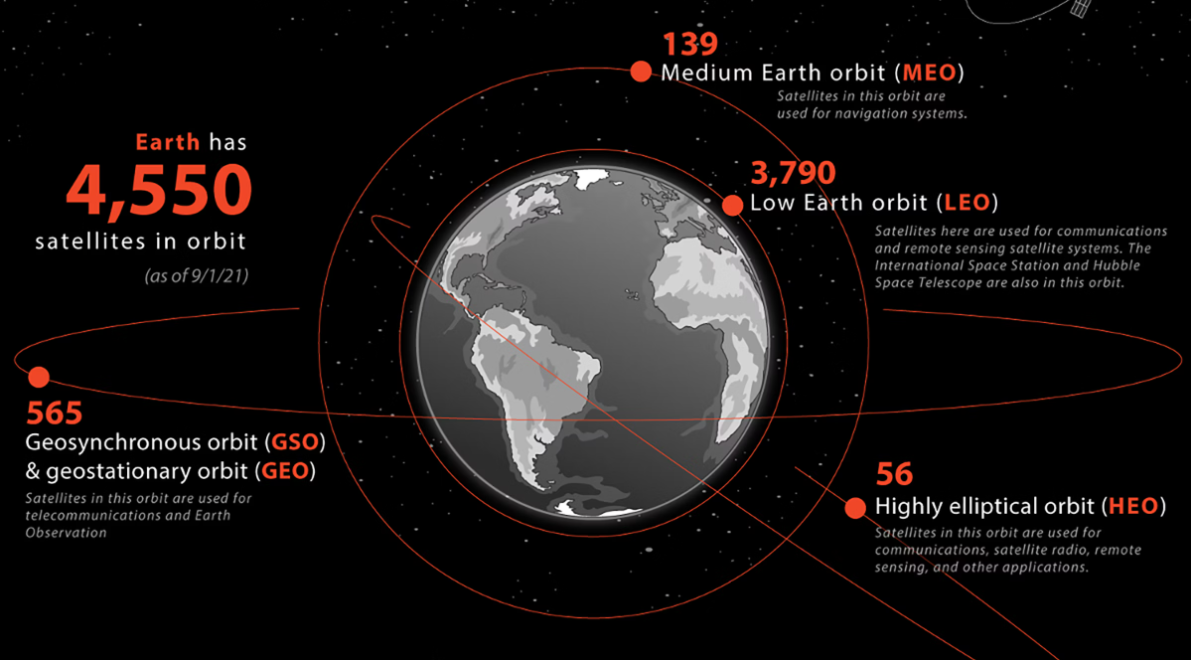
I needed the latest orbital details of satellites so, I leveraged celestrack’s database to gather information of satellites and thier orbital data. There are other sources but requires registration. I donwloaded the TLE files of satellites are operational.
In this visualization, I searched for Medium Earth Orbit (MEO) satellites and couple of Low Earth Orbit (LEO) satellites to understand the magnitude of the distance and how cloose satellites actually revolve around Earth. I googled some MEO satellite names and searched for data in Celestrak. Once you get the TLE data, I copied and pasted the 2 lines in the ‘.txt’ file.
Mathematics involved
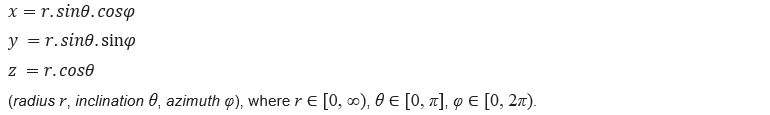
To visualize Earth and orbits of satellite, we need 3-D co-ordinate systems for spherical objects (however, Earth is not exactly a sphere, but instead is a Spheroid. This is the closest approximation in our case.). The following equations enables us to imagine a 3D object using cartesian system:
The same can be replicated in matlab using ‘Mesh”:
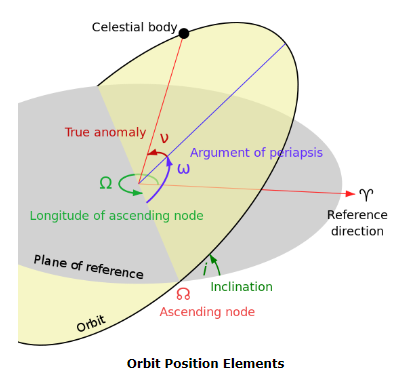
For, orbital elements the following terms are vital to understand the mechanics involverd. I won’t dive deep into orbital mechanics but the orbits made by most satellites are ellipses and can be understood by paremetric ellipse representation and using rotatiojnal matrix representation. First, let’s understand what the terms are:
Eccentricity (e): Eccentricity is a measure of how much an ellipse deviates from a perfect circle. It is defined as the ratio of the distance between the foci of the ellipse to the length of the semi-major axis. Mathematically, it is represented as:

Where: e is the eccentricity.
c is the distance between the center of the ellipse and one of its foci (focus).
a is the length of the semi-major axis.
Semi-major axis (a): The semi-major axis of an ellipse is half of the longest diameter of the ellipse. It is the average distance from the center of the ellipse to its perimeter. In orbital mechanics, the semi-major axis is a fundamental parameter used to describe the size of an orbit. For celestial bodies orbiting a central mass (such as planets around the Sun), the semi-major axis represents the average distance of the body from the center of mass of the system. It is often denoted by the symbol ‘a’.
The semi-major axis is related to the period (T) of an orbit through Kepler’s third law:

For satellites in Earth orbit, the mean motion (mu) is often provided in TLE data. By using this value and the known gravitational parameter of Earth (GM), you can calculate the semi-major axis (a) of the orbit.
For rotation matrix, please refer here. We will create a similar rotation matrix for 3 orbital elements of each axis, since it is a 3D rotation.
Now, we will extract the TLE information from the dataset.
TLE data interpretation
The two lines hold lot of information regarding the satellite identification and orbital data. let’s extract using the following matlab code:
In matlab, I worte the follwoing code to create the rotation matrix which in turn gives the orbit:
Final Code
The code can be clubbed into one fucntion! I aggregated the code in the following way:
Now, we will begin our viz. let’s import the data and use the function:
Output:
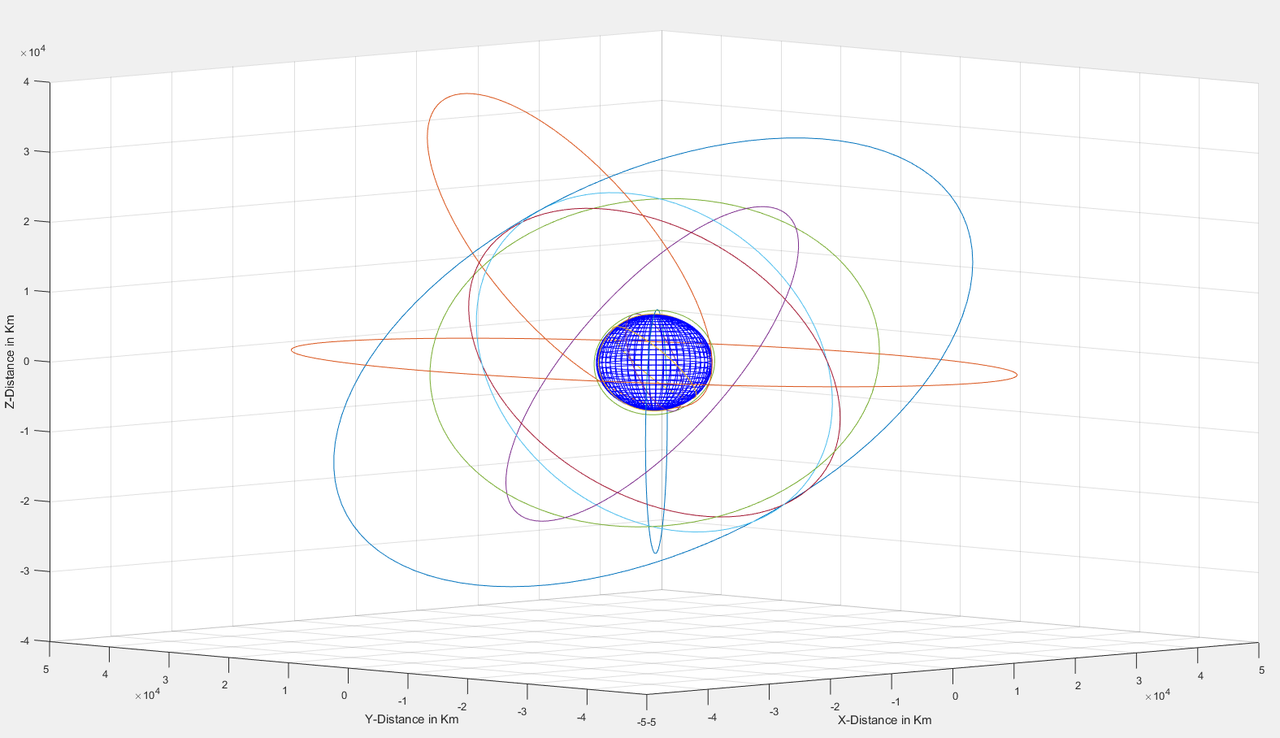
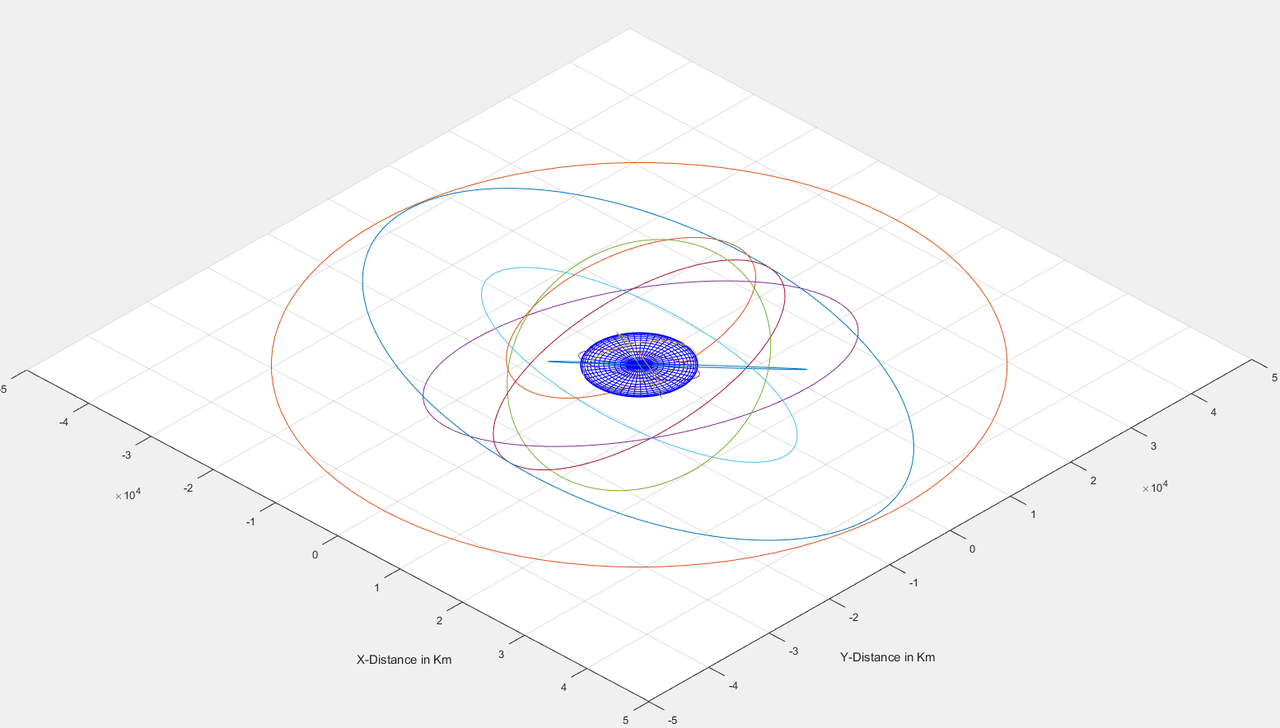
And that’s it!
I hope you enjoyed. Furthermore, this viz can be made more sophisticated by adding lot of details to it but, for now, I will leave it here. Mission accomplished!