
Commodities & Pesticides Data Project
I met lot of farmers in my country in my life. I think I had to hear the farmer’s point of view in using any pesticide in agriculture. I asked, “Why do you think it is important to use pesticide?”. I was expecting some technical answer such as “peticide kills insects or algea that harm our crops”, But he said with a sense of responsibility and concern in his eyes, “If I don’t use pesticides, the amount of food I produce will not be enough to feed all my citizens”. That was a moral and accountable answer. It is true that population is increasing, at least in India. So basically, they pesticides help farmers grow more food on less land by protecting crops from insects or pests, diseases and weeds as well as raising productivity per hectare.
We didn’t talk about health concerns and that’s where government and organizations come into picture. We as consumers undermine the damages of using pesticides, we should be aware nonetheless. I am talking about damages to health and balanced diet. Organizations like USDA ensures that it is safe for consumers to consume a food product/commodity but at the same time, ensure a good practice of usage of pesticides by farmers. Such organizations have a significant responsibility providing knowledge to farmers in terms of increasing technology and safe practices in agriculture and creating awareness among consumers about the product.
I think one of the reasons that USDA made this data available to public is to make sure consumers know what they are eating and ensure safe dietary exposure to consumers.
The Data
The data is publicly available here. I used the latest datset (2022) for this analysis. The 2022 PDP dataset contains data dictionary, reference tables, samples data and results data. It hosts a comprehensive dataset and I decided to make an amazing database with this data.
Database
The file size says it all. I immediately recognized I won’t be able to work on this data on MS excel since this tool has 1,048,000 row limit but, the datsaet has like ~3 million rows. I chose MySQL workbench. I can connect tables, access data from multiple tables and bring data to life.
Importing Data
The main data is in text file and reference tables hold various information regarding the dataset. I separated each sheet in the reference date excel file into multiple excel files so that I will be able to upload into my database. Before I could do anything, I had to provide access/permissions to my server;
Now, I imported using the follwoing query into my server. I was careful not to forget my delimiter type here from the text file.
For importing my samples dataset, I simply used ‘Data Import/Export Wizard’ in mysql workbench under the database and assigned proper data-types. Then, I imported all the necessary reference tables into my database and assigned proper attributes to my datasets;
Analysis and Visualization
To make my project a bit fun, I came up with a scenario. Assume that I work at USDA as a part of data analytics team; Data Analyst. I got an email from my lead after morning briefing as follows:
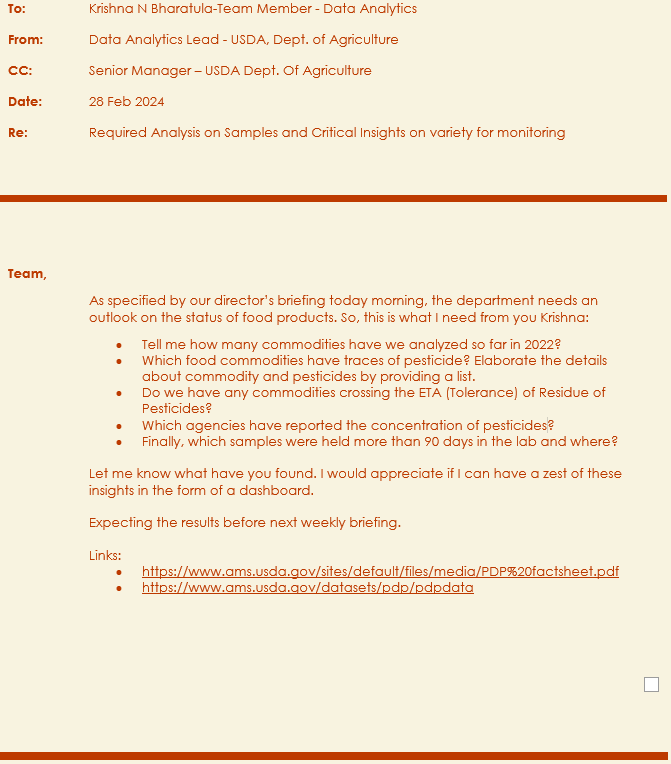
Let’s answer the questions, shall we?
1) How many commodities have we analyzed in 2022?
For this, I need to access commodities list to display name of commodities and count number of test results on each commodities by accessing analysis results dataset. I have to utilize ‘join’ to be able to produce list and export the list for my lead and manager. Thus, I wrote the follwoing code:
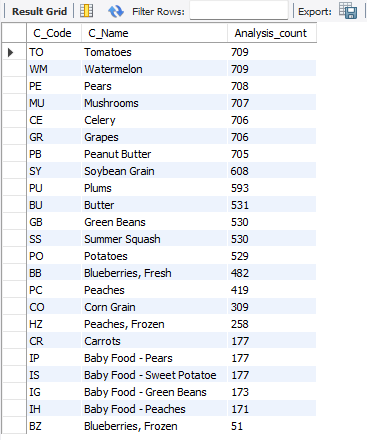
From this list, we can see that we have analyzed 23 types of commodities in the year 2022.
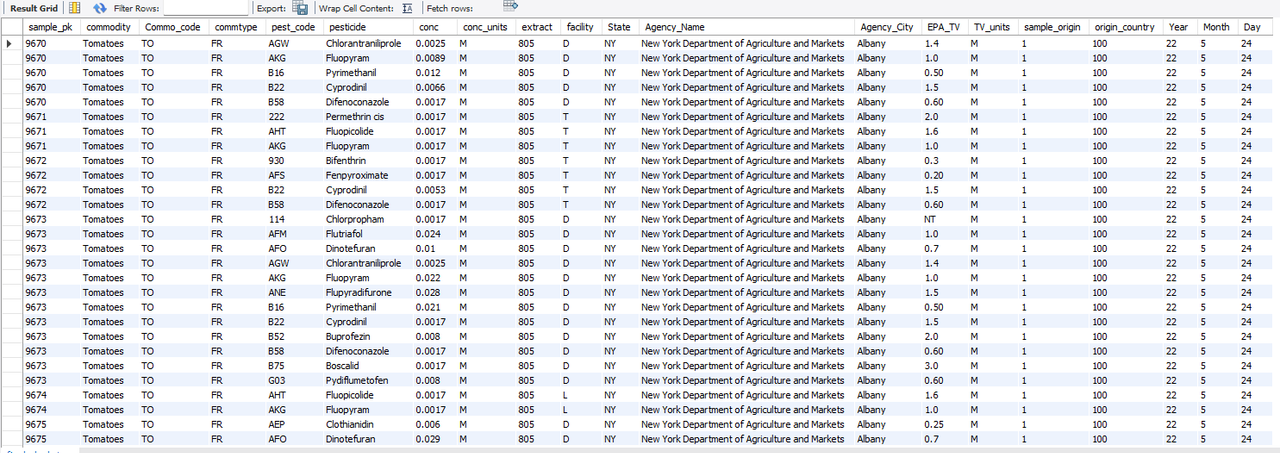
2) Which food commodities have traces of pesticide? Elaborate the details about commodity and pesticides by providing a list.
For this question, I can create a table and drop all the samples and their results where a residue of pesticide has been found. Looks like our manager is interested in only those commodities where a residue of pesticide has been found. I used subqueries along with the follwoing code:
Let’s stick to these samples for now. I accessed respective datasets to provide further details of each result of a sample. I used LEFT JOIN since I wanted to keep the table containing samples with reported pesticide conentration as it is and add matching parameters such as agency that tested, origin of the sample etc. to the table. I wrote the following query:
I created views because, everytime the dataset gets updated, so does this view. Everytime I don’t have to write up a new code. This is where I had the unique idea of creating a stored procedure for my KPIs and export them into csv file. I did create it, which I explained in next section.
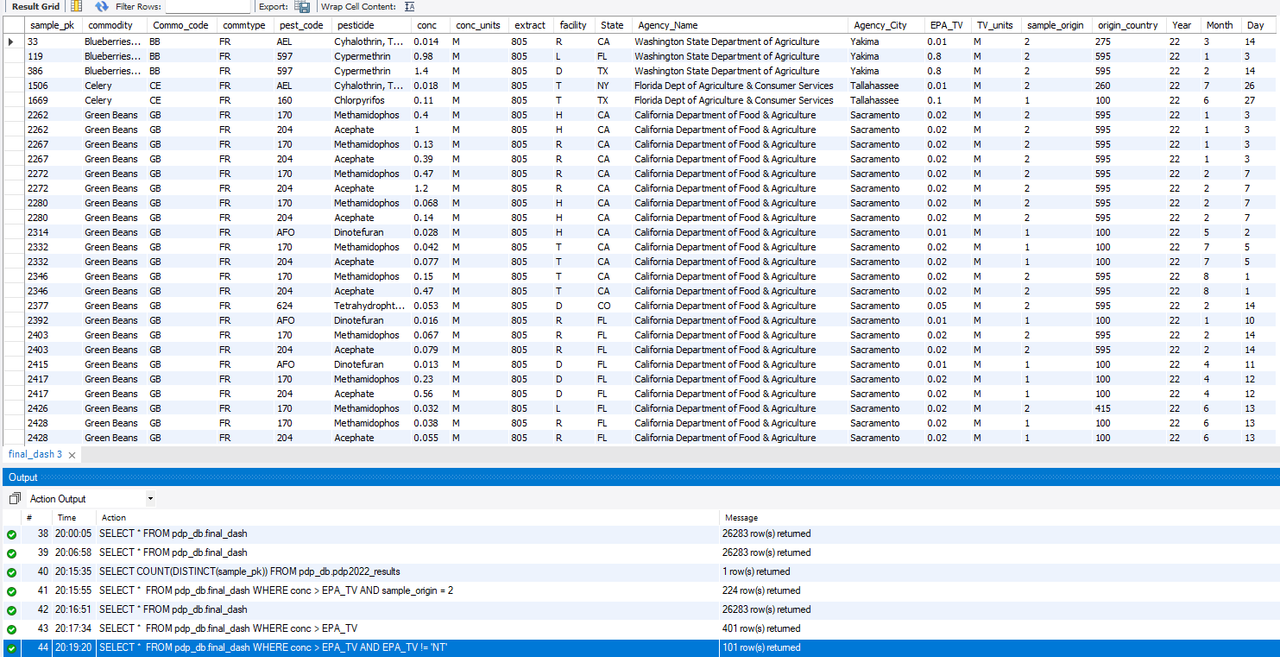
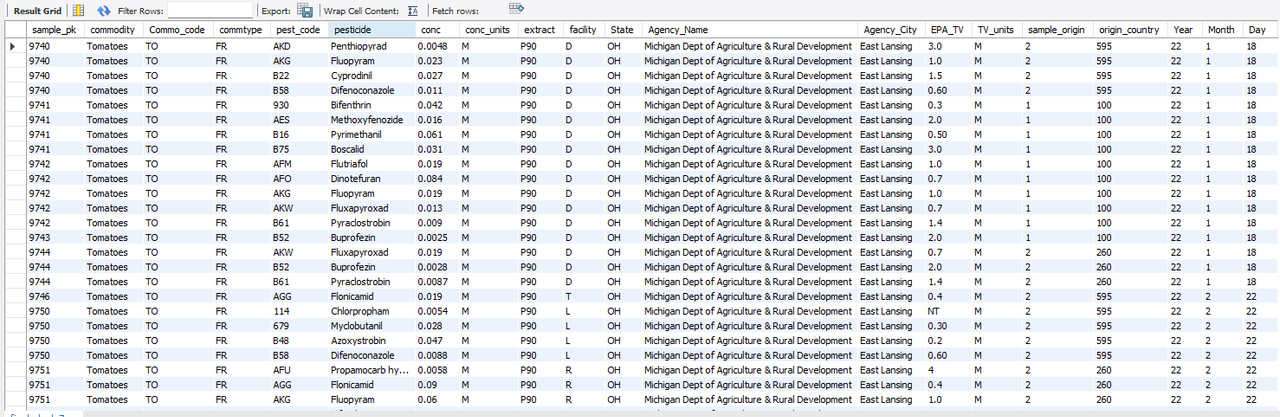
Then, I added tolerance level to it as well as origin (country) of the sample (either imported or domestic). I noticed that for USA ther is no specific code and I didn’t want to leave such cells NULL so, I assigned a custom code for USA; “100”. Finally, my table is now refined by using following code:
Added, when sample was collected, this will help me build a comprehensive dashboard.
Finally, the list will look as follows:
3) Do we have any commodities crossing the ETA (Tolerance) of Residue of Pesticides?
For the answer, I wrote the following code and found there are 101 results of various commodity samples reveal which of them exceeded tolerance levels for residue of pesticide depending on the pesticide name.
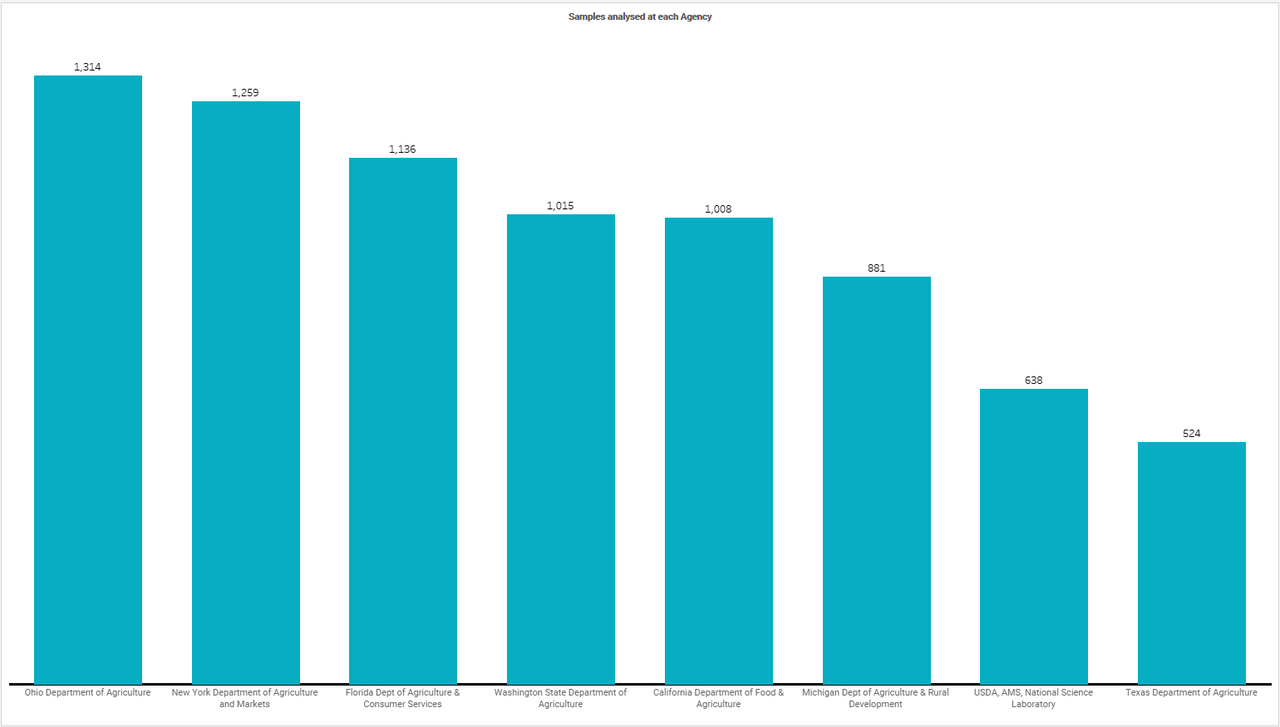
4) Which agencies have reported the concentration of pesticides?
From the above final table I have created, I used tableau here to create a bar chart to show which facilities tested the samples and who reported concentration of residue of pesticides. I uploaded my dataset into tableau and created the plot. The chart is as follows:
5) Finally, which samples were held more than 90 days in the lab and where?
I wrote the following simple query to narrow down how many samples were store for more than 90 days before testing.
And, below code provides the list of those samples:
A total of 1132 analytics results reveal the samples which were held more than 90 days before testing those samples.
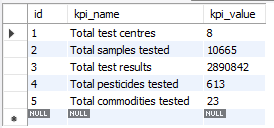
Stored Procedure for calculating KPIs
For tracking KPIs, I came up with a stored procedure. Whenever the dataset gets new entry or updates, I can call this procedure and get the new KPIs for my dashboard.
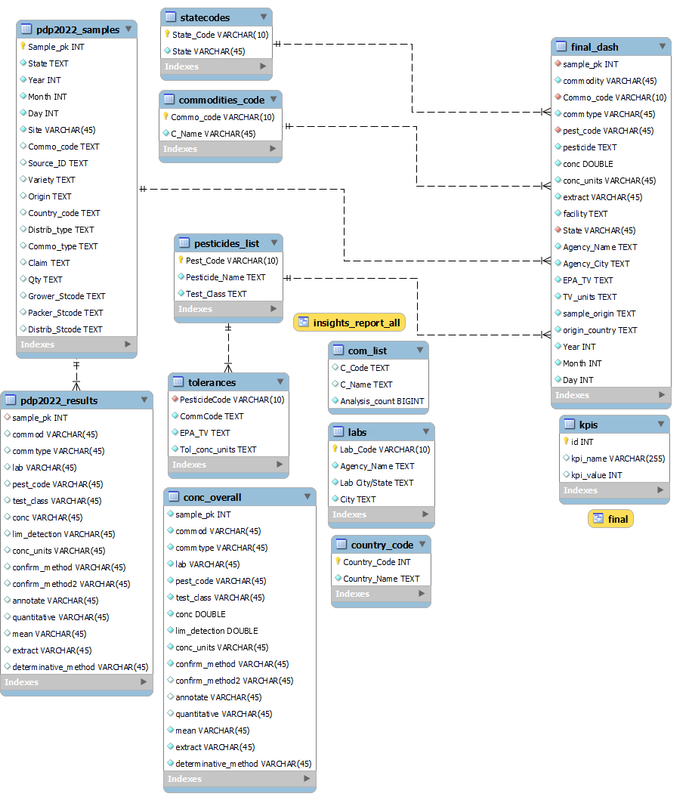
ER Diagram of the Database
After creating a good database, I was able to create a Entity-Relationship Diagram (ERD) of my database highlighting how my tables are connected;
Visualization in Tableau
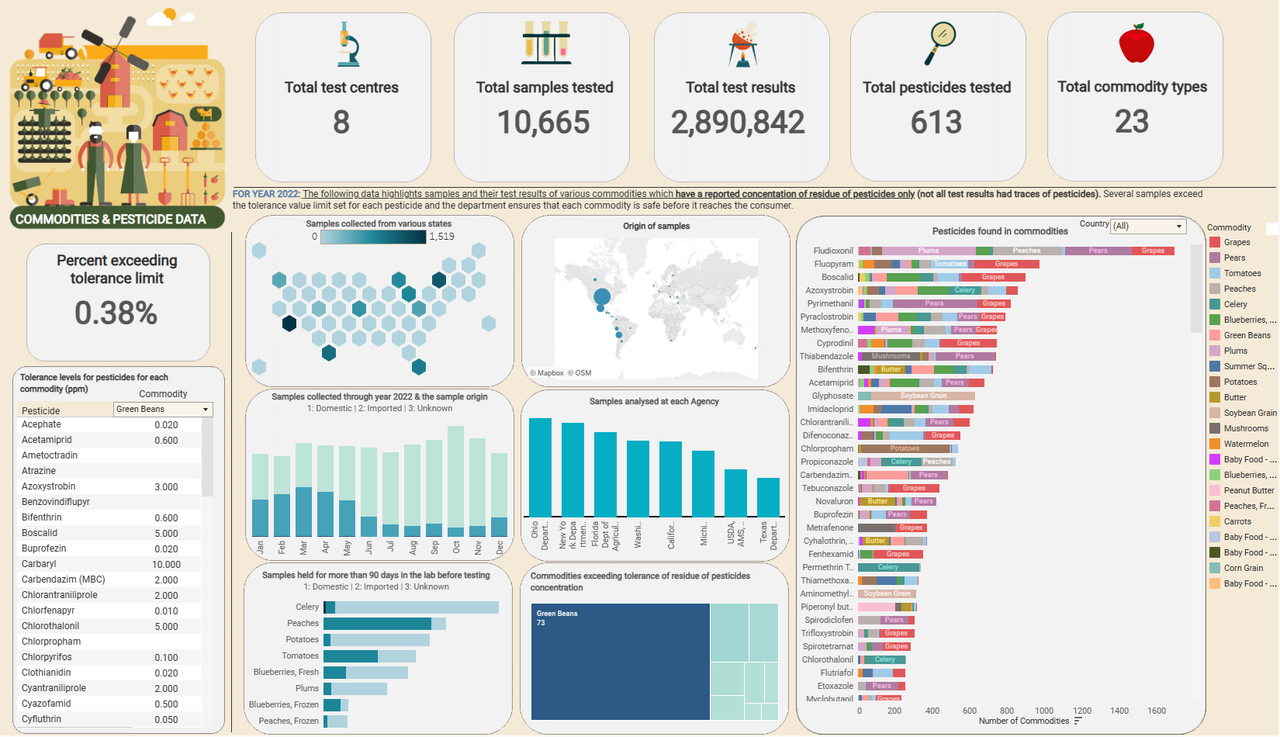
An overall of 26283 test results of samples show residue of pesticide in terms of concentration out of 2.89 million test results.
One of the insights is that samples test results show that only 0.38% of total samples with traces of residue of pesticides exceed the tolerance levels. Almost all commodities are safe and further broken down based on the origin of these commodities, and what kind of pesticides are found on these commodities.
Green beans is the most common commodity exceeding pesticide tolerance levels amongst the samples showing the traces of pesticides.
The following dashboard was created in tableau:
Conclusion
My Dashboard can be found through here.
MySQL has proved again, an amazing tool to access and bring out data that is hidden between millions of rows. This concludes my project and further I am willing to dive into one specific column which seems to be a mess;’Variety’. This column has incorrect spellings and misappropriation of several commodity types such as ‘Blueberries’ or ‘Blue Berries’ or ‘Roma Tomatoes’ or ‘Tomatoes, Roma’ or ‘N/A’ or ‘Na’. There could be more insights in this thought process.
FInally, I would like to thank U.S Department of Agriculture - Agricultural Marketing Service for making this dataset available for public for educational and research purposes.
Thank you for taking time in reading my project report. If you find any mistakes and have any feedback please do not hesitate in reaching out to me at my LinkedIn
Onwards to my next project!